Every company has an origin story. Ours began with a pattern that was impossible to ignore: the physical world was becoming more complex, more instrumented, more expensive to operate, and more essential to human life, yet the data flowing through those buildings had barely evolved. Cameras raised privacy and cost issues. Motion sensors offered only binary signals. Mobile data was noisy, inconsistent, and increasingly regulated. Meanwhile, buildings consumed more energy than any sector in the U.S. economy, wasting over 4 quadrillion BTUs each year: roughly 150 billion dollars in unnecessary cost.
What we saw was a structural gap: the built environment lacked a unified, scalable sensor layer capable of supporting real-time intelligence across all building types. Addressing that gap became our starting point.
⸻
1. Why We Started: The Gap in Spatial Intelligence
The spatial intelligence market had no foundational sensing primitive. Existing approaches (cameras, Wi-Fi sniffers, beacons, radar, mobile analytics) were fragmented and inconsistent. None scaled across the full diversity of building stock. None offered the reliability, privacy posture, or distribution potential needed to support a meaningful software layer for intelligent buildings.
Our goal was straightforward: create a sensing foundation that could function like a nervous system for buildings, providing continuous, high-fidelity measurement of how people move and use space. To work, that sensor needed to be compatible with every building that exists today and every building that will be built in the future.
This led to a simple design question:
What do all buildings (past and future) have in common?
Surfaces.
Floors, walls, ceilings.
If we could instrument one of these surfaces well, we'd have a universal platform for perception. Floors were the natural place to start:
- They are the only surface every person interacts with.
- They span the entire usable footprint of every building.
- They are replaced on predictable cycles through an existing national supply chain.
- The flooring industry already installs billions of square feet annually.
This gave us an opportunity to scale through the supply chain the world already uses, not through retrofits.
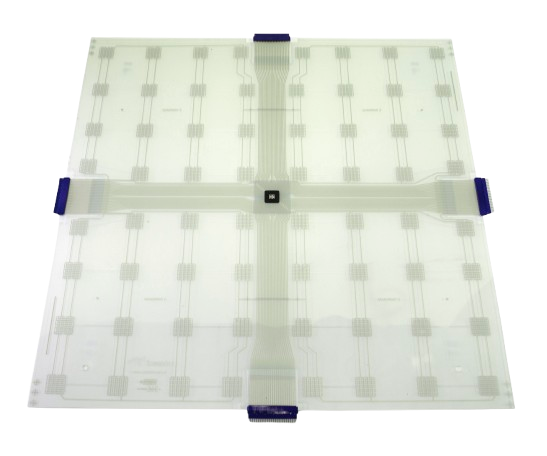
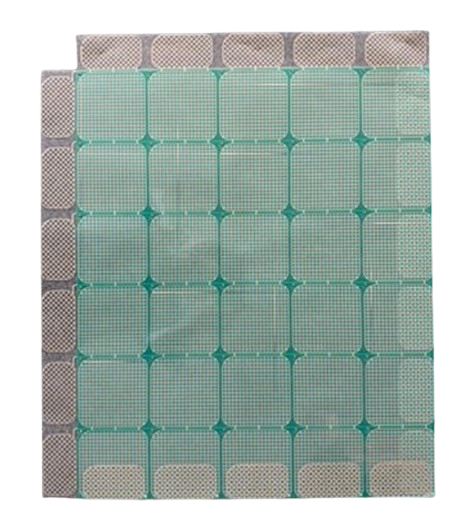
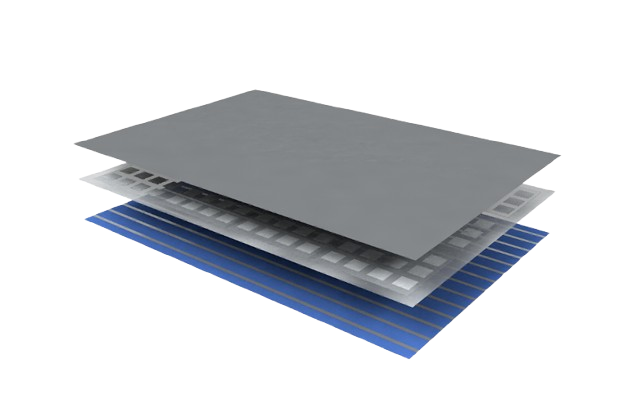
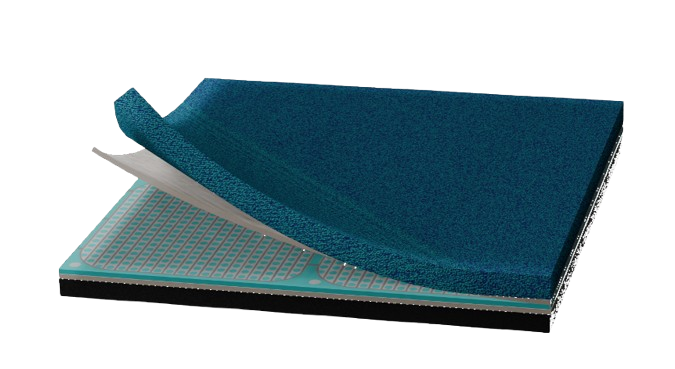
So we studied commercial flooring assemblies: underlayments, adhesives, carpet tiles, LVT, clarifying their tolerances, handling requirements, and installation workflows. Those constraints shaped the design of our sensor: thin, flexible, resilient, thermally stable, and manufacturable at industrial volumes.
The foundation of the product was defined by aligning our sensor design with the way the world already builds, updates, and maintains its floors.
⸻
2. What We Built First: V1 and Proving Monetization
Our first-generation system (V1) was intentionally modular and portable. It was designed to test willingness to pay, prove value, and understand real operational environments. Early traction revealed a strong first market: live events and trade shows.
That environment shaped the product in important ways:
- Demanding physical conditions
Trade show floors endure forklifts, pallet jacks, rolling displays, rapid installations, and overnight turnarounds. If the sensors survived this environment, they could survive virtually any commercial setting. - Unstructured human movement
Attendees move irregularly and unpredictably. If our algorithms could reconstruct movement in this environment, they would perform well in offices, healthcare, retail, or logistics.
These constraints forced improvements to durability, compression modeling, temporal reconstruction, and noise handling earlier than controlled pilots ever would have.
The buyer evolved too. We began with individual brands measuring booth engagement, but the value shifted upstream to convention centers, which discovered operational and layout advantages from accurate occupancy analytics. This validated multi-tenant value and expanded the business case.
V1 demonstrated that customers paid for spatial insights, that value was repeatable, and that a permanent embedded sensing system was worth pursuing.
⸻
3. Where Acceleration Came From: The Department of Energy
After validating demand and feasibility with V1, the next challenge was to prove that a permanent, large-format sensing layer could deliver measurable operational value at scale.
To de-risk this phase, we applied for and won approximately 2.3 million dollars from the U.S. Department of Energy's Advanced Research Projects Agency–Energy (ARPA-E). The program targeted technologies capable of delivering precise, room-level occupancy for HVAC optimization and emissions reduction.
ARPA-E provided:
- Capital to underwrite V2 development
- A structured evaluation environment
- Independent, audited performance data
- A government-aligned validation story for risk-conscious customers
- Credibility needed for discussions with global flooring manufacturers
Results:
- 30–35 percent HVAC energy reduction
- 90 percent occupant comfort
- Verified accuracy and durability in real building conditions
This validation was essential for securing partnerships with flooring manufacturers who needed confidence that embedding sensing capability into their products would deliver real operational benefits.
⸻
4. Validation Into Phase 1: Flooring Manufacturers and Proven Unit Economics
With DOE validation secured, the next step was aligning distribution with the commercial flooring supply chain. The sensor needed to move through the same channels as flooring itself: the world's most prevalent building refresh cycle.
We approached flooring manufacturers as partners. The sensor integrated into their product stack without changing installation workflows or contractor practices.
We now have commitments from two of the top five commercial flooring manufacturers in the world: Tarkett and Mannington. Tarkett alone sells an average of 14 million square feet of flooring per day, giving us a distribution pathway aligned with global scale.
A key advantage is sales reach:
We leverage the existing sales forces of these flooring companies. Their reps already speak daily with the decision makers we target: facility managers, corporate real-estate teams, architects, operators, and contractors. This gives us a scalable go-to-market engine without adding headcount.
Early unit economics confirm the strength of this model:
- $20.67 annual revenue per sensor square foot
- 82.6 percent margin across a five-year LTV
- 7-month customer ROI
- Only 1.5–3 percent sensor coverage needed to power major applications
This establishes a strong foundation for broad commercialization in Phase 1.

⸻
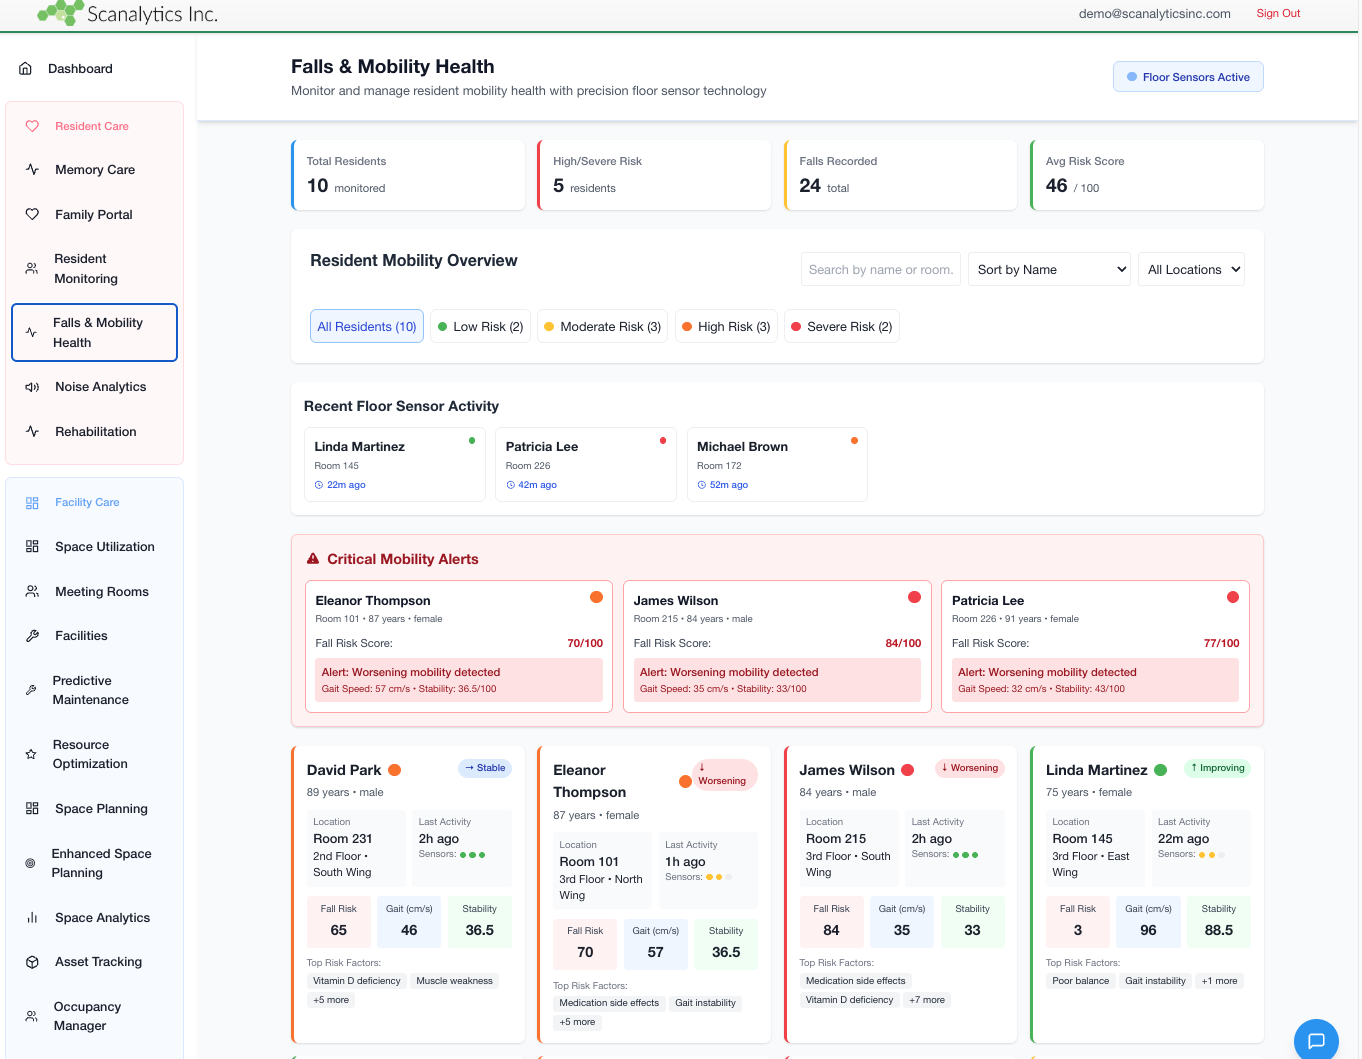
5. Phase 1: Delivering Volume and Value to Direct Building Stakeholders
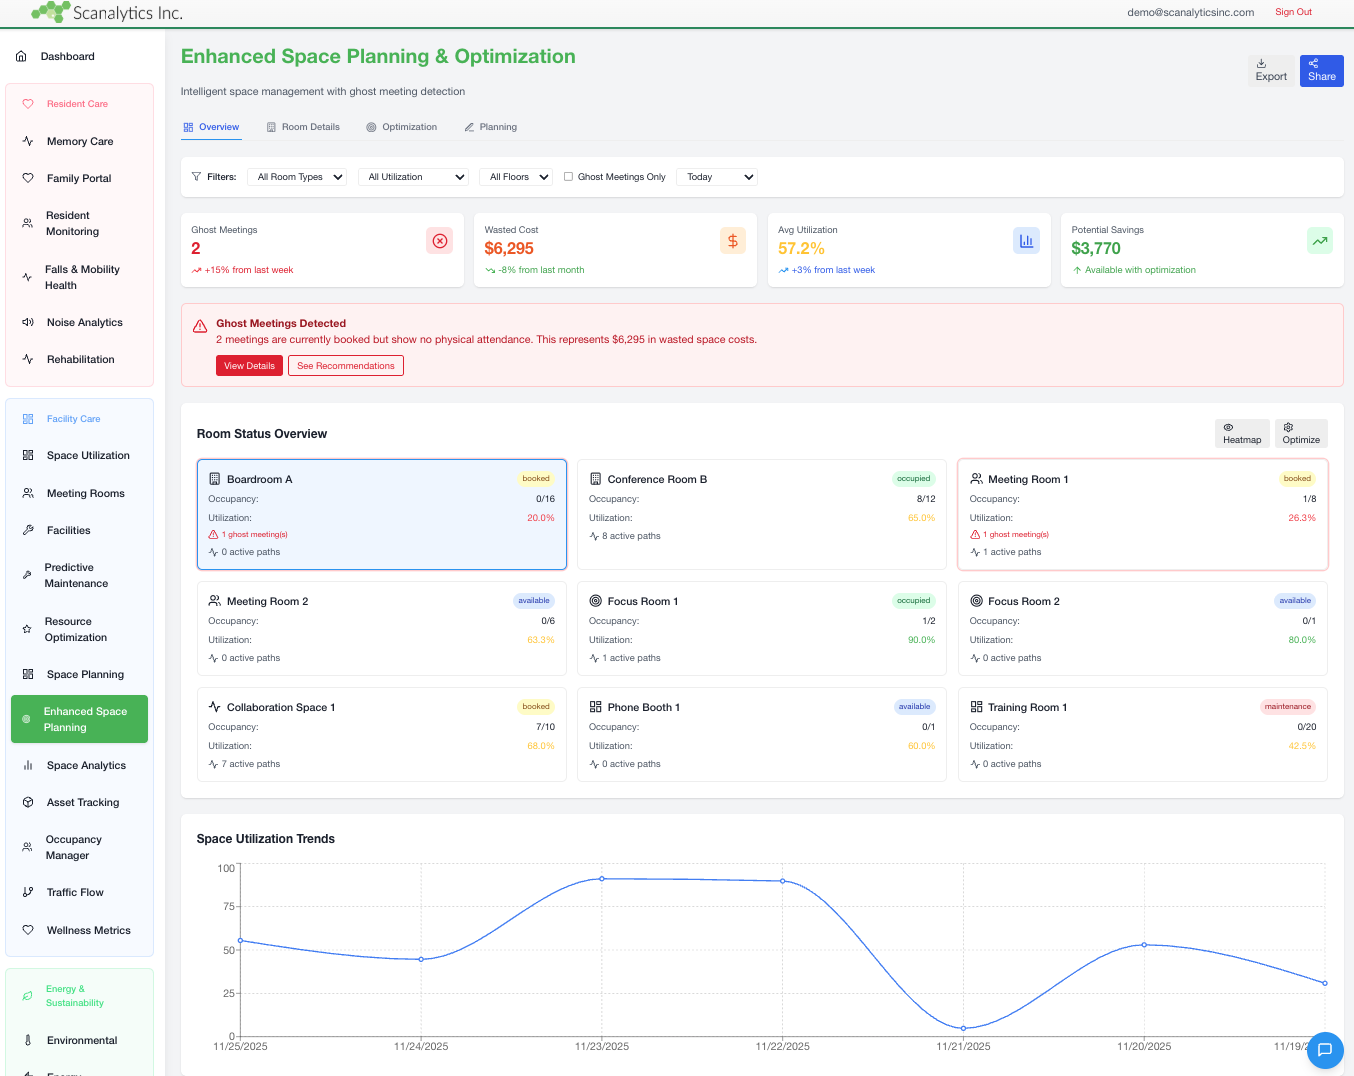
Phase 1 focuses on deploying the sensing layer widely and delivering clear operational value to the people who run buildings. The goal is a large, trusted install base with recurring SaaS revenue tied to well-defined use cases.
Direct stakeholders include:
- Facility managers
- Building owners and operators
- Corporate real-estate teams
- Senior living and healthcare operators
- Security and operations teams
- Retail, hospitality, and venue operators
- Industrial and logistics environments
These stakeholders already buy partial solutions (cameras, badges, motion sensors, mobile analytics) but none provide continuous, building-wide, privacy-safe data.
Why they pay in Phase 1:
- Occupancy-driven HVAC optimization
- Space utilization and planning
- Fall-risk and mobility insights
- Operational routing and cleaning cycles
- Retail dwell and flow analytics
How Phase 1 scales:
- Flooring manufacturers' sales channels
- Real-estate services firms (JLL, CBRE, Cushman)
- HVAC/controls integrators (Trane, Siemens, JCI)
- Systems integrators and workplace-tech VARs
- Architectural and design firms
- Vertical-specific partners in senior living, healthcare, and hospitality
Purpose of Phase 1:
- Establish widespread sensor coverage
- Deliver measurable ROI
- Build recurring software revenue
- Validate cross-vertical use cases
- Create the install base required for Phases 2 and 3
Phase 1 is the foundational layer upon which all future value compounds.

⸻
6. Phase 2: Turning Data Exhaust Into Monetization for Indirect Stakeholders
Phase 2 builds on the install base from Phase 1. Once the sensing layer is installed, additional hardware is no longer the constraint. Growth shifts toward increasing revenue and margin per installed square foot.
A building that installed our system two years ago can adopt new software modules with no hardware changes:
- senior living adds fall-risk or mobility analytics
- corporate campuses add workplace experience or safety modules
- retailers add dwell/conversion modeling
- customers activate leak detection months after installation
This creates a recurring, software-led upgrade path.
As deployments expand across offices, airports, convention centers, malls, and senior living communities, the system produces a continuous stream of anonymized "data exhaust": movement, density, behavior, and flow patterns across physical space.
This data has value to:
- manufacturers
- facilities service providers
- insurers
- logistics operators
- urban planners
- AI model developers
Phase 2 focuses on two vectors:
- More software per installed square foot
Additional applications, optional modules, upgrades, high-margin ARR - Data and analytics for indirect stakeholders
Data-as-a-Service, predictive models, early steps toward a developer ecosystem
Phase 2 is the bridge between building-facing SaaS and the broader spatial data platform.
⸻
7. Phase 3: API Access and the Built World as a Data Primitive
Phase 3 marks the transition from building-level applications toward owning the underlying data layer and enabling an ecosystem around it. This is where the sensing network becomes real-time data infrastructure: a substrate others can build upon. I expand on the broader strategy around substrate economics in The Substrate Economy.
What this phase enables:
- Public and enterprise APIs
- Integration into building OS and digital twins
- Data licensing for AI developers
- Longitudinal behavior modeling
- New classes of applications across insurance, logistics, safety, sports, and more
Why it matters:
This phase marks the transition from application development toward establishing the data infrastructure and ecosystem dynamics that unlock compounding value at scale.
How monetization expands:
- usage-based APIs
- developer subscriptions
- DaaS licensing
- integrations into major platforms
- multi-year cross-vertical data models
Roadmap implications:
- API governance
- developer SDKs
- data governance and anonymization
- scalable ingestion and labeling pipelines
- domain-mapping strategies for spatial models
Phase 3 turns the sensing layer into a surface that other systems, partners, and developers build on.
⸻
8. The Path Forward
We now have the core elements necessary for a scalable spatial-intelligence platform:
- a proven sensing architecture
- real customers and validated outcomes
- distribution through global flooring manufacturers
- early unit economics with strong margins
- clear product-market fit for multiple applications
- a roadmap that expands value per square foot over time
The sensing layer is proven, demand exists, and partners have committed it to their product strategy. The next step is disciplined scale across manufacturing, installation, and software.
The strategic alliance with a hardware manufacturer strengthens that plan. It enables:
- Improved unit economics
Through advanced manufacturing, materials optimization, and circuitry design, margin expands immediately and continues to improve over time. - Access to volume manufacturing
This unlocks large enterprise deployments requiring rapid fulfillment, standardized components, and multi-building rollouts. - Reallocation of internal focus
With hardware stabilized and scalable, Scanalytics directs its bandwidth toward expanding software and data products: the core drivers of long-term value.


⸻
Appendix: The Climate and Energy Strategy
This appendix addresses a distinct dimension of Scanalytics' strategy: the energy and climate impact that unlocks government support, regulatory tailwinds, and a unique subsidy-based business model. While the main narrative focuses on the business evolution and data platform opportunity, this section explores how demonstrated emissions reduction creates a parallel path to scale.
The Climate Problem
Buildings account for 42% of global greenhouse gas emissions and consume 22 quadrillion BTUs of energy annually, most of it wasted. Within commercial buildings, HVAC systems represent 37% of total energy consumption. The inefficiency is structural: most buildings operate on static schedules or rudimentary sensors, conditioning space regardless of actual occupancy.
This represents both a massive environmental challenge and a massive economic opportunity. Reducing building energy waste is one of the highest-leverage interventions available for climate mitigation.

The DOE Solution: Validated Energy Savings
In 2018, Scanalytics received $2.3M in funding from the U.S. Department of Energy's ARPA-E program to validate our technology's impact on building energy consumption. The results were definitive:
- 35% reduction in HVAC energy consumption compared to baseline operations
- 90% occupant comfort rating maintained throughout the study period
- Real-time demand response capability enabling grid integration
This validation established Scanalytics not just as a spatial analytics company, but as a proven energy reduction technology. That distinction unlocks an entirely different class of stakeholder: federal agencies, state and city governments, utilities, and climate-focused investors, all motivated by emissions targets rather than traditional ROI.
Second-Order Impacts: Health Co-Benefits
Energy reduction creates cascading benefits that extend beyond carbon. When buildings consume less electricity, grid operators burn less coal and natural gas. Less combustion means less air pollution: fewer particulates, less sulfur dioxide, reduced nitrogen oxides.
The health impacts are measurable and economically significant:
- Reduced asthma and respiratory infections
- Lower cardiovascular disease rates
- Improved lung function in children and adults
- Fewer hospital admissions and emergency room visits
Research from the health economics field quantifies these benefits: for every $1 saved in electricity costs, cleaner air generates between $0.02 and $0.81 in health benefits, depending on regional grid mix and population density.
This multiplier effect isn't captured in traditional building ROI calculations. But governments notice. Cities facing air quality violations, states with asthma epidemics, and federal agencies tracking healthcare costs all see this technology as delivering outcomes far beyond energy bills.

The Government Subsidy Model: A Parallel Path to Scale
The combination of validated energy savings, emissions reduction, and health co-benefits positions Scanalytics for a unique business model that operates in parallel to the traditional commercial market: government-subsidized deployment.
Here's how it works:
Stage 1: Demonstration and Validation
Scanalytics demonstrates significant energy savings and emissions reduction capabilities through deployed systems and third-party validation (DOE, utilities, academic research). This creates the evidence base governments need to justify subsidies.
Stage 2: Subsidy and Incentive Programs
Federal agencies (DOE, EPA), state energy offices, and city climate programs build subsidy or incentive plans that cover the initial installation costs for buildings. This dramatically lowers adoption friction: building owners receive proven energy savings and operational improvements at minimal or zero upfront cost. Governments achieve emissions reductions toward their climate targets. Both sides win.
Stage 3: Manufacturing-Level Integration
As deployment scales and impact is demonstrated across thousands of buildings, governments begin subsidizing sensor integration at the manufacturing level rather than the installation level. This shifts the subsidy upstream: flooring manufacturers receive funding to embed sensors during production, Scanalytics gets paid for sensors by government programs rather than building owners, and the incremental cost to buildings approaches zero.
Stage 4: Tax Incentives and Regulatory Support
Buildings that activate the sensing system receive tax credits, accelerated depreciation, or utility rebates. Cities and states may eventually incorporate smart flooring into building codes or green building certifications (LEED, WELL, etc.), creating regulatory tailwinds that further accelerate adoption.
This model transforms Scanalytics' customer base. Instead of selling exclusively to building owners who evaluate ROI on operational cost savings, we sell to:
- DOE and state energy programs buying emissions reductions
- City governments buying air quality improvements
- Utilities buying demand response and grid flexibility
- Health departments buying public health outcomes
Each of these buyers has budgets allocated specifically for climate and health interventions. They aren't constrained by traditional ROI timelines. They're buying measurable progress toward policy goals.
Policy Strategy: The Carbon Credit Flywheel
Beyond direct subsidies, Scanalytics is positioned to participate in emerging carbon credit markets. The concept: verified emissions reductions from building energy savings become tradable carbon offsets.
Scanalytics would establish a "Smart Surface Carbon Action Reserve," a standardized protocol for quantifying, verifying, and registering emissions reductions from intelligent flooring deployments. Each installed square foot generates measurable, auditable carbon credits that can be sold to corporations seeking offsets or governments meeting compliance targets.
This creates a third revenue stream:
- Direct revenue from building owners (SaaS subscriptions)
- Indirect revenue from data buyers (analytics licensing)
- Carbon credit revenue from verified emissions reductions
The carbon credit model also creates a flywheel: more deployments generate more credits, more credits generate more revenue, more revenue subsidizes further deployments, which generate more data, more data improves energy optimization algorithms, better optimization increases energy savings, higher savings generate more credits. The system compounds.

Why This Matters for the Core Strategy
The energy and climate dimension of Scanalytics' strategy doesn't replace the business model outlined in the main narrative. It accelerates it.
Government subsidies and carbon credits reduce customer acquisition cost and expand addressable market. Buildings that wouldn't justify ROI on operational savings alone become viable customers when subsidies cover installation. This drives Phase 1 deployment velocity.
More deployments mean more data exhaust, which feeds Phase 2 monetization. Faster install base growth shortens the timeline to Phase 3 platform economics.
The climate angle also provides strategic optionality. If commercial sales cycles slow, government programs offer an alternative path to scale. If carbon markets mature faster than expected, that revenue stream accelerates sooner. If new climate regulations emerge (carbon taxes, building performance standards, etc.), Scanalytics is positioned as the compliance solution rather than scrambling to adapt.
Most importantly, this dimension transforms the company's narrative. Scanalytics isn't just a data platform or a SaaS business. It's climate infrastructure. That positioning unlocks institutional capital, attracts mission-driven talent, and builds alignment with the largest capital deployment trend of the next decade: decarbonization.
This appendix outlines a complementary strategy that runs parallel to the core business evolution described in the main post. Both paths reinforce each other, creating multiple routes to scale and compounding returns across hardware, software, data, and policy.